
Dek: Sharing a GPU across live broadcast AI workloads can improve utilization, but the real capacity limit is the first feed that misses its latency or reliability target.
A GPU that looks underused on a dashboard may still be the wrong place to consolidate more live media monitoring. Average utilization says little about what happens when several feeds simultaneously hit speech bursts, scene changes or inference retries.
For broadcasters evaluating local AI or cloud GPU spend, the purchasing question is not simply how many feeds fit in memory. It is how many independent services can meet their deadlines through a busy hour and a failure.
Why it matters
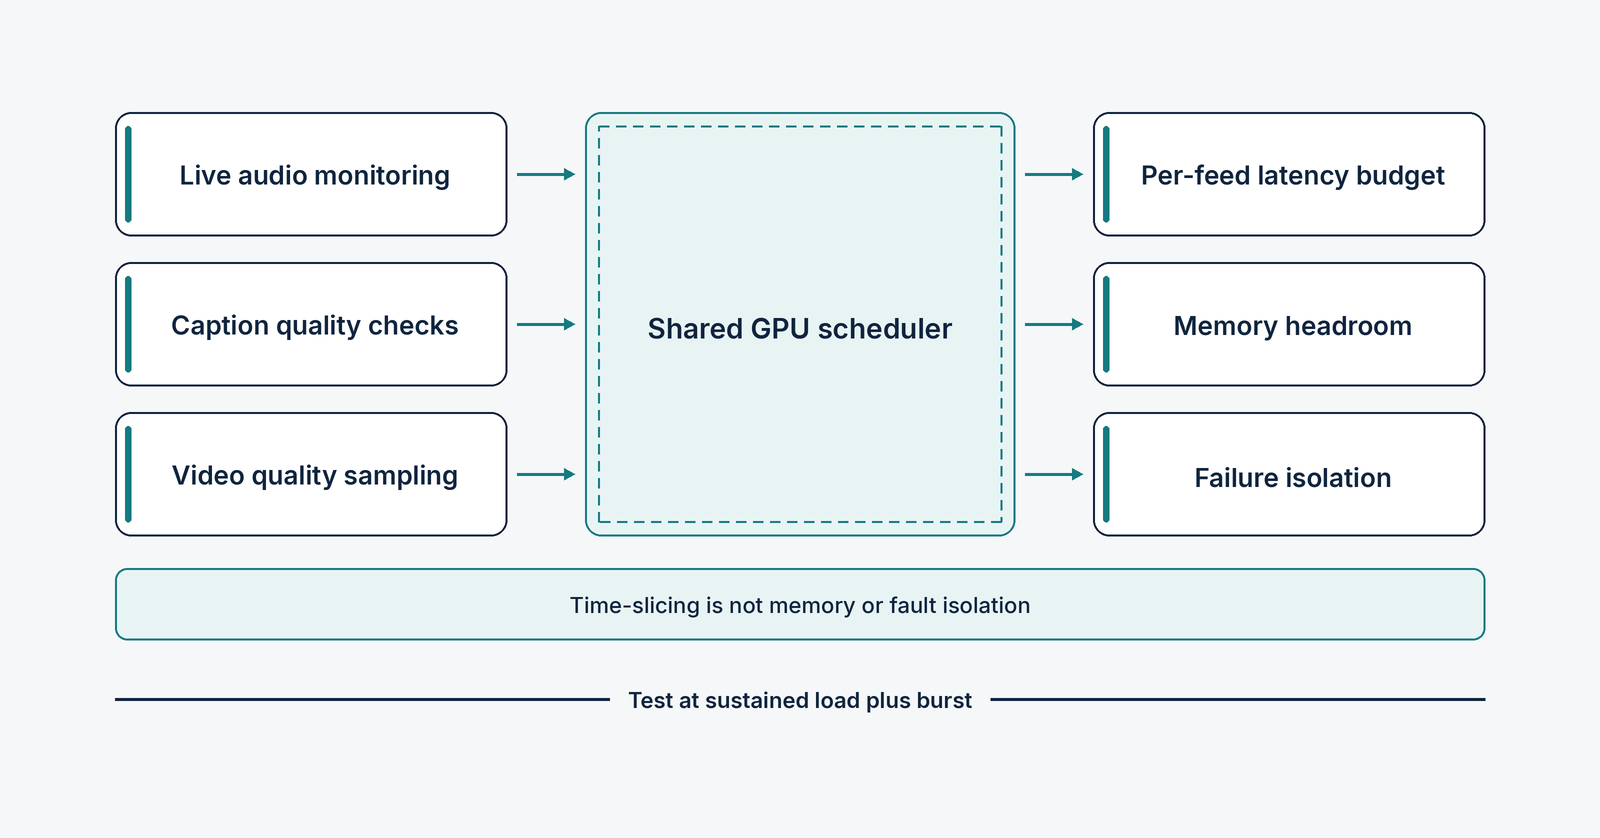
NVIDIA's Multi-Process Service documentation, updated November 4, 2026, describes cooperative multi-process GPU sharing, reduced context switching and options for resource partitioning. Its GPU Operator documentation makes an important distinction: Kubernetes time-slicing can oversubscribe a GPU, but does not provide memory or fault isolation between replicas. Multi-Instance GPU, on supported hardware, offers stronger hardware partitioning.
Those are engineering capabilities, not promises of broadcast-grade performance. Neither a Kubernetes resource count nor an advertised GPU model establishes the number of live channels that can be monitored safely.
Six acceptance tests for shared inference
1. Establish the single-feed baseline. Run each workload alone using representative source media. Record processing latency, missed analysis windows, GPU memory, CPU demand and restart behavior. Separate audio-language checks from frame-sampling and caption-related workloads because their resource profiles differ.
2. Add feeds gradually, then test bursts. Increase concurrency in measured steps. Include fast dialogue, multilingual transitions, high-motion video and simultaneous reconnects. Report worst-window and high-percentile latency alongside averages. A system that keeps up over an hour can still miss a critical short event.
3. Verify memory limits and isolation. Check model weights, decoder buffers, batching and transient allocations. Deliberately exhaust one workload in a controlled environment. Does the scheduler reject new work, restart one process or disrupt every monitored feed? Time-slicing alone should not be treated as an isolation boundary.
4. Observe the entire pipeline. Track ingest, decode, queue depth, inference, result delivery and alarm generation separately. NVIDIA's DCGM feature guide documents device health, process statistics and GPU telemetry. Pair those signals with application-level deadlines. A healthy GPU can still be serving results too late to matter.
5. Rehearse a node failure. Kill a worker, interrupt its source and simulate a GPU reset under supervision. Measure detection time, reassignment time, lost analysis windows and alarm behavior. Verify that a stale or missing result is labeled unknown rather than silently reported as normal.
6. Calculate usable capacity, not peak throughput. For each deployment option, count only feeds that meet the agreed deadline and failure criteria with operating headroom. Include standby capacity, power, networking, software support and operator time. AWS's EC2 instance guidance explicitly recommends benchmarking applications on candidate instance types, rather than choosing solely from specifications.
The economics operators should compare
Consider a hypothetical GPU host costing $900 per month in fully allocated infrastructure expense. If tests prove 15 reliable feeds, infrastructure cost is $60 per feed-month. If an overloaded configuration advertises 25 feeds but only 12 meet the acceptance criteria, the defensible figure is $75 per reliable feed-month, not $36.
These numbers are illustrative arithmetic, not vendor quotes or measured performance. A cloud comparison must also account for running hours, redundancy, data movement and operational ownership. On-premises capacity may be attractive for stable 24/7 workloads, while elastic infrastructure can be useful for temporary events or uneven demand. The choice depends on measured load and the recovery design.
What to ask before procurement
Request a reproducible test matrix showing model versions, precision, sampling frequency, source characteristics, concurrent feed count, p95 and p99 latency, memory headroom and failure results. Ask whether GPU sharing uses time-slicing, MPS, MIG or dedicated devices, and what isolation each configuration actually provides.
The operating principle is simple: buy guaranteed service capacity, not nominal GPU occupancy. For a monitoring system, the expensive failure is not idle silicon. It is an unobserved problem on a live feed because the shared compute queue was busy.
Image credit: Original Amira Labs editorial diagram. Conceptual architecture only; no benchmark results or specific customer environment depicted.
Technical references: NVIDIA MPS, NVIDIA GPU sharing, NVIDIA DCGM, AWS EC2 guidance.